|
Solution-Centered Support
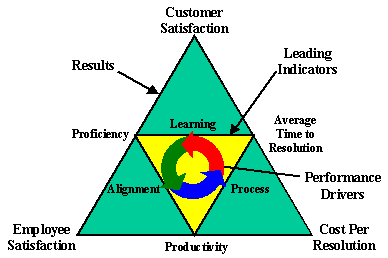
Performance Drivers, Leading Indicators, and Results
As a support organization pursues the primary dimensions of
success, i.e., increased Employee Satisfaction, increased Customer
Satisfaction, and lower Cost Per Resolution, i.e., the Results,
it is appropriate for the organization to measure the Leading
Indicators for these Results, i.e., increased Proficiency, lower
Average Time to Resolution, and increased Productivity.
The difficulty which generally arises is that when organizations
seek to manage the Leading Indicators it tends to drive the numbers,
yet seldom producing the desired Results. The leading indicators,
like the dimensions of success, are the direct result of an organization
performing the correct activities and continually developing their
proficiency at these activities.
For the leading indicators to continue to improve the organization
needs to focus on the Performance Drivers, i.e., Process, Alignment
and Learning. By continuing to develop the organization's performance,
i.e., effectiveness and efficiency, in the area of the performance
drivers the leading indicators will track in the the desired direction,
as will the dimensions of success.
The short of it is, "One can't win tennis games by watching
the scoreboard. To win tennis games one has to focus on playing
the best game possible, while continuing to improve their skill."
The following diagram presents the relationships between the
Performance Drivers, Leading Indicators, and Results.

Definitions
Proficiency: Proficiency
is a multi-dimensional indicator reflecting staff (engineer) capability
and capacity, as influenced by recruiting, hiring, promoting,
training, coaching, and management practices. It is a leading
indicator of Employee Satisfaction and Customer Satisfaction.
Team Proficiency is a measure of the ratio of Apprentice, Journey
and Master solution engineers within each product support group.
During SCS start up the ratio will be skewed to the apprentice
level until nomination and selection for the next skill level
is completed. An organization should have a standardized nomination
and selection process requiring peer nomination and certification.
We've defined proficiency for the different levels in the following
manner:
- Author: An author is a qualified engineer who is developing
technical, content and process skills. Authors require more management,
coaching and reviewer time to help them acquire the level of
proficiency demonstrated by an editor-level solution engineer.
Authors are still developing skills that add value and contribute
leverage, both to themselves and to the group.
- Editor: At this level, the qualified engineer has
demonstrated technical problem-solving skills; writes good solutions
requiring only minimal modification by the reviewer and exhibits
good workflow habits. They consistently add value to solutions
they use and are sought out to assist in solving difficult problems.
Those editor-level engineers who exhibit excellent interpersonal
and mentoring skills may be nominated for training and certification
as coaches. Coaches are certified editor-level solution engineers
who are qualified to coach other engineers on the team to develop
solutions; to develop good workflow habits and to write solutions
competently.
- Publisher: A publisher is one that has mastered the
use of all of their tools and exhibits the highest professional
standards in technical, content and process skills. The publisher
is certified to publish her or his solutions directly into the
solution set (public or internal) without review. The publisher
mentors coaches and reviews the solutions presented by editor-level
and author-level engineers.
Average Time to Resolution (ATR):
ATR is a multi-dimensional indicator that reflects the organization's
response to customer-driven activity (input). ATR includes elements
of (a) first call resolution; (b) call closure rate; (c) hold
time & abandon rate and (d) backlog. ATR is a leading indicator
of Customer Satisfaction and Cost Per Resolution.
Productivity: This is another
multi-dimensional measure that considers the staff required to
resolve an experienced call volume. Productivity is a bit difficult
to calculate for a specific time because calls are closed over
a period of time. What makes sense is to calculate the average
time to resolution for calls over a period of time, and then to
divide that by the average staff available for the same time period
of time. This will provide a sense of the average productivity
over the period.
Where to Begin
Organizations tend to focus on those things which are easy
to measure, because they're easy to measure. Generally along with
a focus on what is easy to measure, targets are set, and management
focuses on the targets. What happens it that teams will reach
the targets -- though generally not in a manner that was expected
or desired. As we have seen repeatedly demonstrated, and quite
painfully, is "What gets measured, gets manipulated."
In an attempt to avoid this target / manipulation syndrome
there are no targets for the leading indicators and results. Teams
should begin by measuring the leading indicators. When the measures
are presented to management, management should ask the team about
the acceptability of the current values, the trends, and inquire
as to current plans to affect the desired change in the number.
If one focuses on the number they will get manipulated. One must
focus on behaviors that are responsible for producing the numbers.
The numbers then provide an indication of the extent to which
the focus is appropriate or should be altered.
While all the leading indicators are all interrelated Proficiency
is the foundational component. Proficiency, being the foundational
component, is the most appropriate indicator to measure and develop
first. Once a group has established practices around measuring
and developing proficiency, the team should then add Average Time
to Resolution and Productivity to their set of measures. Once
practices for tracking the leading indicators are established
the team should begin measuring the final results they are achieving
in the area of Employee Satisfaction, Customer Satisfaction, and
Cost Per Resolution.
While the leading indicators provide a sense of the direction
in which things are going the organization should not attempt
to drive the leading indicators. What the organization, teams,
and individuals should focus on is continually developing their
understanding and proficiency at doing the right things and doing
them increasingly well. This attention to effectiveness and efficiency
will result in the appropriate trends in the leading indicators
and the desired results.
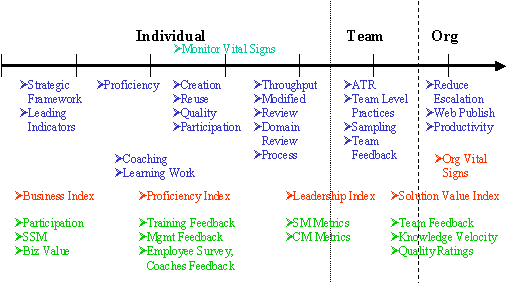
The diagram below identifies the activities which should be
the object of focus throughout the adoption of Solution Centered
Support.

Monitoring Leading Indicators
Admittedly Proficiency is the most involved measure for a team
to get its arms around. This stems primarily from the fact that
this is an aspect of team performance that the team has not addressed
previously. Yet, because this component is the foundation of the
teams future success it is the most appropriate place to start.
And if the team is not profiled how will the manager and coaches
understand what areas to focus on for proficiency development
and improvement?
Process, Content, and Technology are three dimensions of proficiency.
Depending on the extent to which an individual demonstrates and
understanding and skill in each of these areas, their proficiency
will be characterized as Author, Editor, or Publisher level.
- Process
- Demonstrates a solid understanding of SCS processes
- Demonstrates good problem solving techniques
- Consistently leverages the workflow to solve problems
- Consistently displays effective workflow techniques (participation,
capture, clarify & statement match, search, link)
- Manages rework and closes CSRs effectively and within standards
- Content
- Consistently develops solid content that doesn't require
modification to meet content standards
- Captures problem-solving approach within the context of the
published solution
- Consistently improves solutions of others when encountered
- Consistently captures the customer experience
- Consistently uses statements & terms to increase relevance
and connectivity to solution set
- Technology
- Fully knowledgeable of the product set they support
- Demonstrates effective problem-solving skills for the product
set they support
Each individual is evaluated from 1 to 3 in each dimension.
The items listed above are what a person should demonstrate to
rate a 3 in each dimension. The sum of the individual dimension
evaluations results in the individual being classified as Author
(1 to 4), Editor (5 to 7), or Publisher (8 or 9). The team profile
is then displayed as a matrix. As part of this profiling the coach
and manager should lay out a plan of development for each individual
within the team to assist them in reaching the Master level. This
then becomes the individual's coaching and training development
program.
|
Member |
Process |
Content |
Technology |
Total |
Level |
| Tom |
1 |
1 |
2 |
4 |
Author |
| Dave |
1 |
2 |
3 |
6 |
Editor |
| Alice |
2 |
1 |
1 |
4 |
Publisher |
| Mike |
1 |
1 |
1 |
3 |
Author |
| Dave |
3 |
3 |
2 |
8 |
Publisher |
| Sara |
2 |
3 |
3 |
8 |
Publisher |
| Richard |
2 |
2 |
1 |
5 |
Editor |
| Thomas |
1 |
2 |
2 |
5 |
Editor |
A Set of Examples
The following charts are intended to demonstrate the appropriate
trends for a group which is developing and continuing to improve
the results it produces on an on going basis. Each chart covers
the same 3 month time period.
theWay of Systems *
Feedback *
Musings
Copyright © 2004 Gene Bellinger
|