Figure 1
After spending a number of hours laboring over several of the
concepts put forth by David C. Lane and Chris Smart in their article
on "generic structures" in the Summer 96 issue of System
Dynamics Review I started toying around with some of the Archetype
Stock & Flow models I had previously created. After tinkering
with several of my Archetype implementations I came to the conclusion
that the relation between Systems Thinking Diagrams (STDs), or
Causal Loop Diagrams (CLDs), and Stock & Flow simulation models
was so loose as to be almost meaningless. I found that it was
very easy to make the Stock & Flow diagram look very much
like one of the Archetypes, while altering the embedded equations
I could make it produce behavior patterns similar to any one of
about half a dozen other Archetypes. So what's the implication?
I found myself very concerned about being able to construct diagrams
from which I could infer essentially very little. It seemed that
if I was to make any sense out of this there would have to be
a rigorous method of translating STDs/CLDs into S & F models
that would provide a level of confidence I could live with. The
only other alternative that came to mind was to chuck the whole
mess and start over; an alternative that didn't sit well either.
Therefore, after pondering the question to a point of distraction,
for longer than I'd like to remember, the following is what I
finally came up with as a method, or a set of conventions, for
translating STDs/CLDs into S & F models.
Systems Thinking Diagrams are composed of only two components,
elements and influences. An influence also has a direction, indicated
by an arrow, and an indicator as to whether the influenced element
is changed in the same (S) or opposite (O) direction as the influencing
element. The simplest diagram I could come up with containing
these elements is:
From this diagram there are only a couple things which are implied:
Some things that can't be inferred from the diagram, and are usually included in the associated description, are:
Stock & Flow Diagrams are composed of four different components:
Stocks, Flows, Converters, and Connectors. I understand the labels
may vary slightly in different arenas. These labels were taken
from the ithink software documentation.
As I understand it there are several conventions for Stock &
Flow diagrams:
A diagram containing all of these elements is:

From this diagram, which just happens to be a reinforcing loop, there are several things which are implied:
Any understanding beyond this would require an understanding of the actual equations within the individual items.
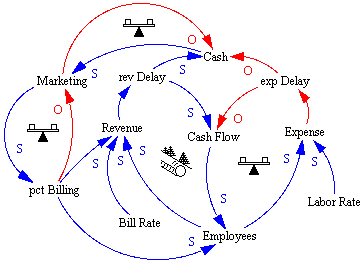
I started out to construct a simple STD/CLD to use for this
purpose, yet 15 minutes later I ended up with the following diagram.
As such I would advise that you don't spend too much time worrying
about its completeness; for I'm sure it's not.

This is a STD/CLD for some service business that bills out
employee services to clients, and yes I know there's no service
quality identified in the diagram.
The translation of this diagram to a SFD will be performed based
on several assumptions which I'll iterate as I go.
Assumption # 1: STDs/CLDs contain no flows!
I'm still trying to figure out just why I feel this is so. Yet,
from past translations I'm sure I have confused the situation
by treating one or more of the influences or elements as flows.
Maybe this becomes clear by the time I finish this.
Assumption # 2: If Assumption # 1 is correct then all the
elements on the above diagram must be either Stocks or Converters.
Assumption # 3: Stocks represent things that accumulate
and don't reflect instantaneous change.
From these assumptions it would seem to make sense that Employees,
Cash, and pct Billing are Stocks.
The part that still confuses me somewhat has to do with when I
have two or more influences for a single Stock as in the following
diagram.

It would seem that this could be implemented in one of two
ways:

or as:

I guess the point I really wrestle with is, "Can these
be different or are are they essentially equivalent?" My
conclusion is that when both the inflow and outflow originate
from and terminate in clouds these two diagrams are equivalent.
Yet, I can envision situations where one diagram might better
portray the situation being modeled than the other. If the model
is such that flows are between Stocks then there is a very substantial
difference in terms of the affect there is on the model.
Based on the above assumptions the STD/CLD of Figure 3 would readily
translate into the following SFD.

This diagram simply takes Figure 3, changes Employees, pct
Billing, and Cash to Stocks, creates flows, flow1, flow2, and
flow3, and moves the influences that were to the Stocks to the
appropriate Flows. It is my perception that if I use this method
to translate STDs/CLDs to SFDs I am less likely to repeat some
of my previous errors.
And yes, there is an added influence from pct Billing to flow3
which represents the fact that pct Billing is perceived to drain
over time as sort of a natural effect.
On 4/27/05 Rober
Lamb commented that he didn't believe "pct Billing"
was a viable stock, and I agree with him. Robert also commented
that, "I think that to model this segment convincingly, the
scope needs to include an inventory of work-sold-but-not-yet-carried-out
(which is a stock) and a sales pipeline with conversion rates
between leads, warm prospects, and firm proposals (each of which
are separate stocks). Conversion rates would be driven by marketing,
perceived quality, and product development..." Thanks for
the feedback Robert.
Looking forward to your comments at to whether all this makes
any sense. Just click on the envelope below to send me some mail....